Tangkak property prices
Real registered sale prices from NAPIC/JPPH: 675 sales since 2021.
Where it is
Tangkak, Tangkak
Tangkak is a sub-area (mukim) of Tangkak, Johor, with 675 registered sales since 2021. Over the last 2 years the median price was RM420k (RM277 psf), with price-per-sqft up 15.5% versus 2021. Mostly 2-sty Terraced. Real registered sale prices from NAPIC/JPPH.
Price trend
Quarterly median sale price, all property types.
What sells here
Median price by home type, with each type's share of 2025 sales.
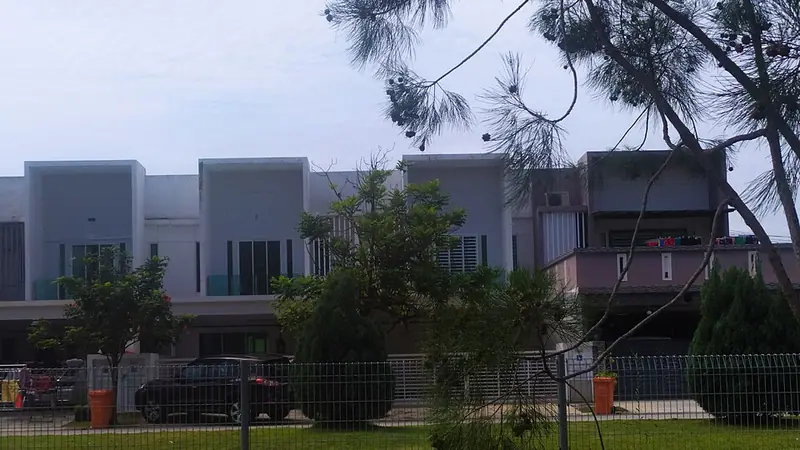 2-sty TerracedRM580k39% of sales
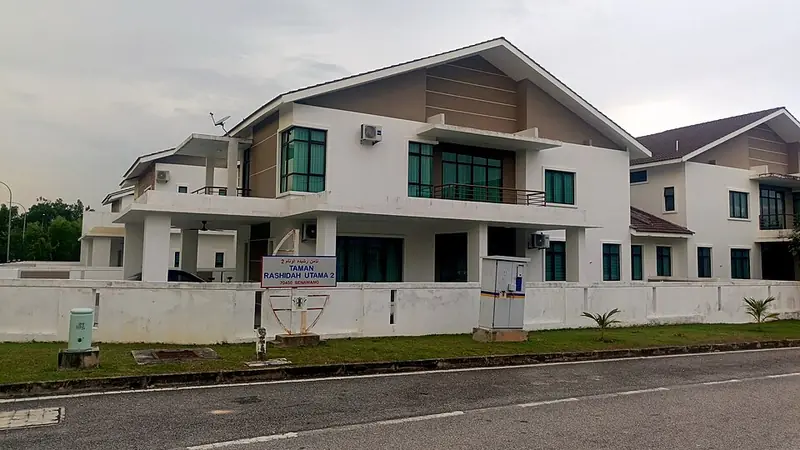 2-sty Semi-DetachedRM840k8% of salesCluster HouseRM507k5% of sales
Most transacted projects
100 projects tracked in Tangkak
Frequently asked
What is the median property price in Tangkak, Tangkak?
The median registered sale price in Tangkak (a sub-area of Tangkak, Johor) in 2025 was RM420,000 (RM277 per sq ft), based on 675 NAPIC/JPPH transactions since 2021.
Are property prices in Tangkak rising or falling?
Tangkak's price-per-sqft is up 15.5% since 2021 (a mix-neutral measure of real appreciation).
What type of property sells in Tangkak?
Mostly 2-sty Terraced, which is 39% of 2025 sales.
Is Tangkak freehold or leasehold?
98% of Tangkak transactions are freehold and 2% leasehold.
Photo credits: Double-storey terraced houses in Bandar Sri Sendayan, Seremban, AyyanD (CC BY-SA 4.0) · Semi-detached houses in Taman Rashidah Utama, Senawang, Wikimedia Commons contributor (CC BY-SA 3.0)