Pekan Bukit Changgang property prices
Real registered sale prices from NAPIC/JPPH: 68 sales since 2021.
Where it is
Pekan Bukit Changgang, Kuala Langat
Pekan Bukit Changgang is a sub-area (mukim) of Kuala Langat, Selangor, with 68 registered sales since 2021. Over the last 2 years the median price was RM420k (RM450 psf), with price-per-sqft up 43.8% versus 2021. Mostly 1-sty Terraced. Real registered sale prices from NAPIC/JPPH.
Price trend
Quarterly median sale price, all property types.
What sells here
Median price by home type, with each type's share of 2025 sales.
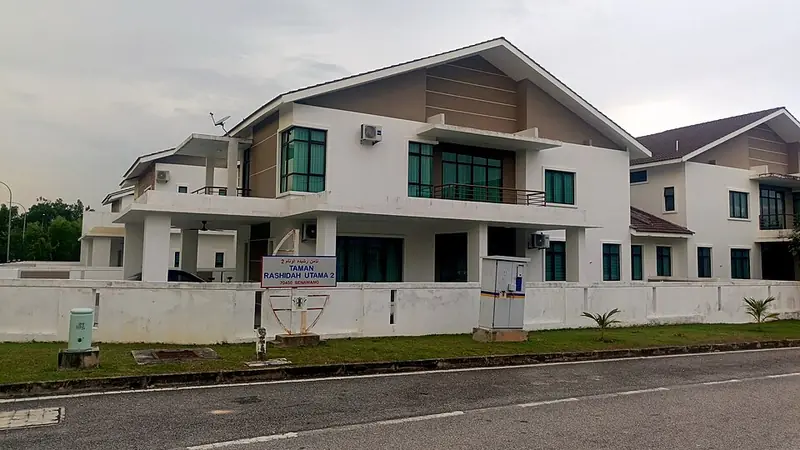 1-sty Semi-DetachedRM480k33% of sales
Most transacted projects
8 projects tracked in Pekan Bukit Changgang
Frequently asked
What is the median property price in Pekan Bukit Changgang, Kuala Langat?
The median registered sale price in Pekan Bukit Changgang (a sub-area of Kuala Langat, Selangor) in 2025 was RM420,000 (RM450 per sq ft), based on 68 NAPIC/JPPH transactions since 2021.
Are property prices in Pekan Bukit Changgang rising or falling?
Pekan Bukit Changgang's price-per-sqft is up 43.8% since 2021 (a mix-neutral measure of real appreciation).
What type of property sells in Pekan Bukit Changgang?
Mostly 1-sty Terraced, which is 67% of 2025 sales.
Is Pekan Bukit Changgang freehold or leasehold?
85% of Pekan Bukit Changgang transactions are freehold and 15% leasehold.
Photo credits: Semi-detached houses in Taman Rashidah Utama, Senawang, Wikimedia Commons contributor (CC BY-SA 3.0)